
X
How might I use H3D detectors at my plant?
Here are sixteen ways...
1. Location of primary source terms
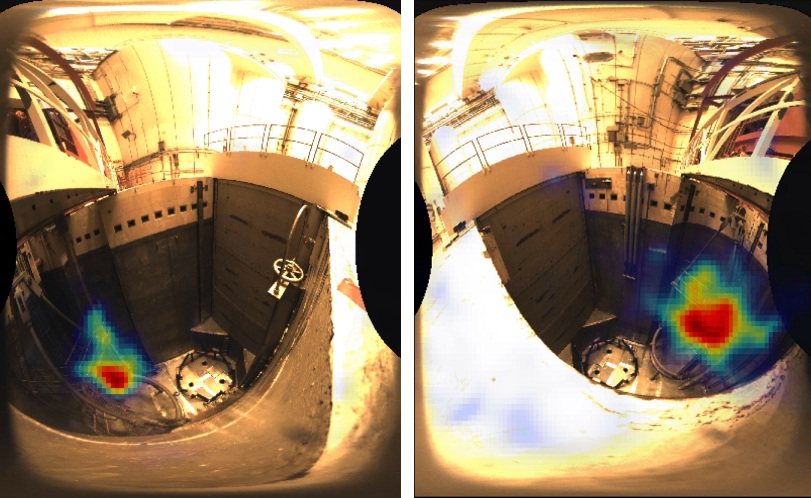
The H100 or H400 gamma-ray camera can be used to locate the primary source(s) of radiation before work will be performed in some area. These pictures were taken at the side of a reactor cavity before work was performed in it. In the first measurement (first picture), the drain in the far left corner was identified as a primary contributor to the source term. Moving the H100 to the other side of the cavity, which shields the system from the drain direction, another, unexpected, source term of the wall of cavity was identified. H100 can also determine the isotopic composition of each hot spot. Thus, the pit could be cleaned before work progressed.
In another example, survey measurements showed that a piping unit was radioactive. However, it wasn't clear which part was responsible for most of the dose. The H100 was positioned to view the area and it was discovered that a pipe segment under the floor was producing most of the dose, not the piping unit as originally expected. Unlike previous work where this hot spot had not been identified, the operator was able to lay down shielding on the floor to reduce the dose to workers.
In a third example, the H100 was used to see emission lines from radioactive tungsten coming from specific pipes. This was responsible for elevating dose rates in a certain area of the plant such that maintenance could only be completed during an outage. On further investigation, the tungsten was found to be from pump-seal material that became activated in the coolant. By replacing the pump seals, tungsten was removed, lowering the dose rate such that routine non-outage maintenance could be completed in that area of the plant.
2. Verification of temporary shielding performance
In some situations, ALARA mandates that shields be installed prior to personnel working in the area.
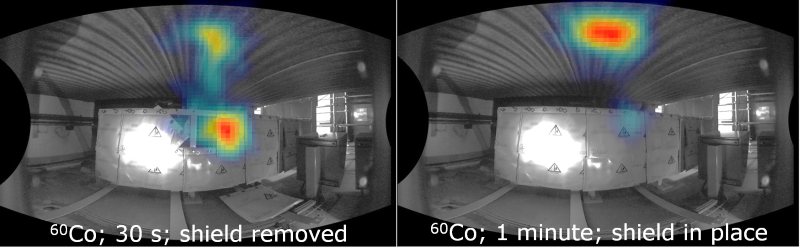
The H100, H400, or P100 can help to verify the adequacy of temporary shielding by identifying the primary contribution to the dose from each isotope. The distribution of gamma rays from each isotope can be measured before and after a shield is added to help validate its effectiveness. Furthermore, gaps in the shield can be identified through the image. For instance, the images below show the same region with and without shielding. It is clear that the addition of shielding reduces the dose from one direction below that from another hot spot coming from the room above. Adding more shielding here won't reduce dose as much as shielding the other direction.
3. Finding discrete radioactive particles
It can sometimes be hard to find discrete radioactive particles with a survey instrument because one must put the probe directly over the discrete radioactive particle and move slowly enough to tell that the count rate is elevated there. However, by imaging the entire region in a single measurement, a hot spot will appear over the particle. For example, one plant discovered that a few hot Cs-137 particles were painted into a floor. These had not been identified before with a survey meter, though it was known that the count rate was elevated there. A quick image using H100 pinpointed the location of the discrete radioactive particles, which were then removed. H100 and H400 are also used to find hot particles on equipment and scaffolding, preventing personal-contamination events.
4. Locating isotopes in shipping containers
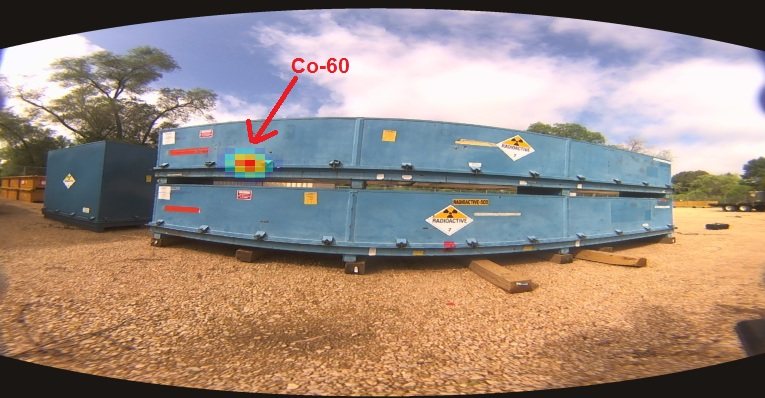
H100 and H400 have been used to inspect outgoing shipping containers to confirm their contents and shielding. In a single measurement, the detector will locate the hottest point on the box, from its perspective. That point can then be metered to check if it exceeds the authorized dose limit. The H series can also be used to inspect received shipping containers to better understand the isotopes within, and know where in the container they will be. The image below shows a source within a shipping container. Measurements at different angles localized the hot spot in three dimensions.
5. Locating and tracking crud in pipes and valves
Metallic corrosion products from surfaces in the coolant circulation loop are brought into the reactor core by coolant circulation. There, they are activated. These activated corrosion products may then circulate with the coolant and deposit on piping surfaces, especially at elbows or valves.
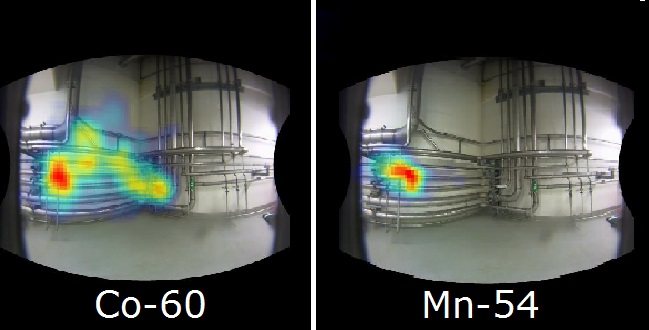
Using Compton imaging, the H series identifies the primary build-up locations of these products. Because of its excellent energy resolution, a distinct image can be made for each different isotope, allowing the user to determine areas where some activation products preferentially appear. This "radiation forensics" can be used to learn about plant chemistry and operation. The image of each isotope can be compared before, during, and after crud bursts to observe the burst's efficacy and how the products travel. Correction for efficiency and attenuation can give the activity of the crud. The H100 or H400 can easily be carried to different areas to make these measurements. This image shows buildup of Co-60 and Mn-54 in the various pipes. Co-60 is present in multiple locations, but Mn-54 is highly localized.
6. Tracking sources through time
The variation of activity through time can tell a lot about plant chemistry and operations. By comparing measurements over time - for instance pre-, mid-, and post-outage - one can draw important lessons about the movement and generation of various isotopes. H100 and S100 has been used extensively at some plants before and after chemistry changes or outages to see variation in the type, amount, and location of contamination.
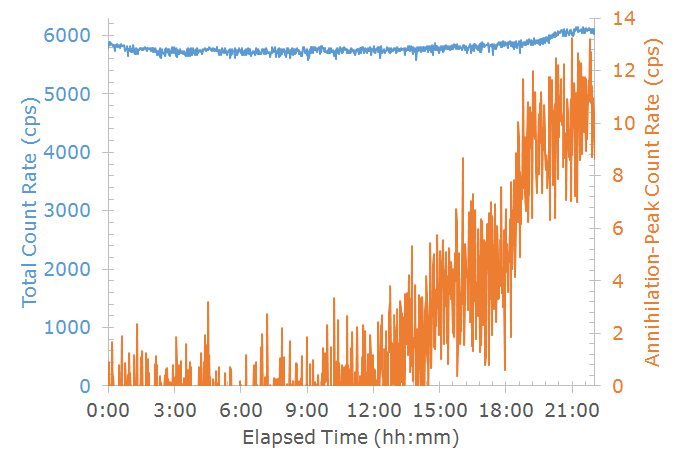
This plot shows the count rate recorded by H100 near the primary coolant water during reactor startup. While the total count rate increases slightly, the count rate from the 511-keV annihilation peak increases rapidly. This peak is due to positron annihilation from positron-emitting isotopes and N-16 gamma-ray interactions.
7. Identifying fuel failures
Fuel failures can create challenges to radiation protection because of the release of alpha-emitting actinides. The fission product Cs-137 is also released in fuel-cladding leakage, so the presence of Cs-137 can hint of the presence of actinides. However, during operation, the strong gamma-ray field from coolant activation products such as N-16 can overpower the Cs-137 signal when using some detector systems.
The extremely high peak-to-total ratio and excellent energy resolution from H100's or H400's large-volume CZT detector allow the Cs-137 662-keV peak to be identified even when in a strong N-16 field. Furthermore, imaging Cs-137's 662-keV line discloses where Cs-137 is most-strongly present.
8. Clean-up verification
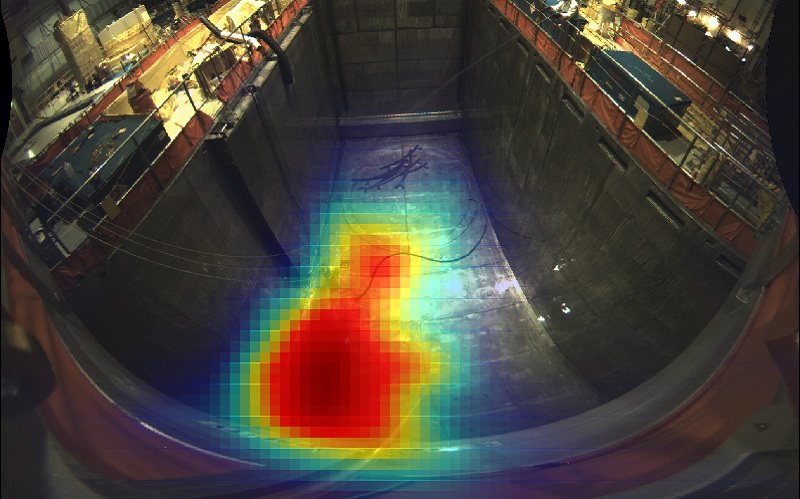
Some areas of nuclear plants become contaminated during routine operation and must be cleaned. Imaging the distribution of gamma-ray emission from each isotope before and after the cleanup can verify the cleaning was successful. This picture shows the distribution of all radioactive materials during one step of the cleaning process of a pit after the reactor was flooded during a refueling outage. A hot area in the left corner is observed.
9. Determining spatial extent of contamination
In other situations, a user might be interested in determining whether a small spot or a region is contaminated. For example, at one plant, an initial survey showed a high count rate in a sink, but it was unclear whether this was due to contamination on the entire bottom of the sink or just in the drain itself. H100's image of the sink showed that the primary contamination was coming from just the drain itself, simplifying the cleanup.
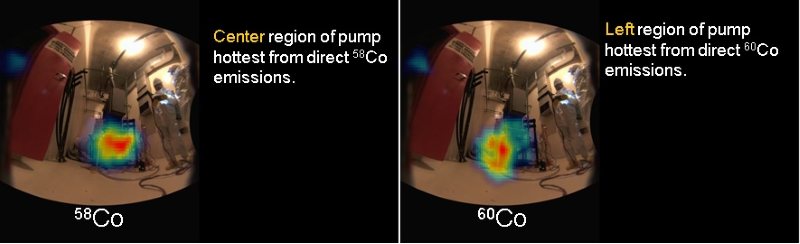
In another example, shown below, different regions of a pump were found to be contaminated with different isotopes. Knowing these regions clarifies our understanding of the contamination events and the best way to clean up the pump, if required.
10. Isotopic characterization and quantification
In many circumstances, users are concerned with the isotopes primarily responsible for a gamma-ray field, or the isotopes present on a part that will require work.

H3D detectors have the advantage of excellent energy resolution, high peak-to-total ratio, and high efficiency compared to other CZT instruments. The ease of detecting a weak isotope in a strong background scales directly with energy resolution, so H3D detectors' great energy resolution allows them to see even weak isotopes. Energy resolution near 1% FWHM at 662 keV allows the detectors to distinguish peaks from nearby peaks and the continuum. Furthermore, their high efficiency reduces measurement time, and its high peak-to-total ratio further improves detection of weak isotopes. With a prior efficiency calibration, the activity of materials in a known geometry can be determined. Some H series users have discovered the existence of legacy isotopes previously masked by portable survey instruments and radiation fields. The spectrum shows some common lines that are often observed at a nuclear power plant, measured with H3D's CZT technology.
11. Filling in blank areas of traditional survey maps
Traditional radiation surveys are plotted on a map to show the dose rate at various locations. But, because of ALARA, it is hard to record the dose everywhere. Images from H100 or H400 can help to fill in the missing points. An image of one side of the room, with source directions color-coded by intensity gives a continuous distribution of where the hot and cold regions are. These images can be very helpful to work planners and workers as they maintain ALARA. Some users post print-outs of H-series images on the doors to radiation areas, which quickly informs workers of the hot spots to avoid.
12. Emergency response
In emergency scenarios, it is important to understand the situation as soon and as accurately as possible. Accidents will occur without time for advance planning, and during some situations, it may be impossible to get close to the site. H100 and H400 can be important tools to immediately understand what contamination may be present and where it may be - even at a distance from the site.
First, because H3D detectors do not need to be cooled, they can go from storage to operation in minutes, and they are light and compact enough to transport easily and quickly. Again, because of their high efficiency compared to other CZT systems, results can be obtained quickly. Due to their excellent energy resolution and large peak-to-total ratio, these results will report the isotopes present. Their imaging capability can be used to quickly determine the spatial distribution of the hottest sources. For instance, consider an accident where plumes occur over neighboring reactor units. H400 could be used to determine if either or both of the plumes contained gamma-ray-emitting isotopes and the isotopic composition of each, even from far away, as long as the plumes are angularly separated.
13. Decommissioning and decontamination
Detecting radioactive contamination that is of similar strength to the natural background is difficult, but necessary during decommissioning and cleanup.
H400 offers a number of advantages in this environment, including high imaging efficiency, isotope discrimination, and portability. High imaging efficiency means that it can make an image of gamma-ray intensity isotope-by-isotope in a reasonable time, even near background levels. Given enough count time, H400 is capable of detecting and imaging sources weaker than natural radiation background. Therefore, H400 is a good tool to identify residual hot spots that need to be cleaned isotope-by-isotope. Once these are identified and cleaned, a non-imaging detector can be placed close to perform clearance measurements.
In this 2-day measurement with H100, a Cs-137 source is 5 meters away, through two walls, producing less than 200 nR/hr at the detector. A Fiestaware plate is also located nearby. Though the Cs-137 peak in the spectrum is much smaller than peaks from background or the Fiestaware source, the source direction can be located in the image. Additionally, you can see the distributed source of gamma rays emitted from the U-238 decay chain in the Fiestaware.
14. Identifying other sources during reactor operation
During operation, the strong gamma-ray field from coolant activation products such as N-16 can overpower signals from other sources that will be most important during the next shutdown.
Due to its excellent energy resolution, H3D detectors are capable of detecting and imaging weak sources in a hot background. The measurement on top of the cavity (see case 1) was conducted when the reactor was at full power and the H100 detector was receiving many counts from scattered N-16 lines. However, since H100's energy resolution is superior to other room-temperature detectors, we can use a very narrow energy window for imaging reconstruction to minimize the background interference.
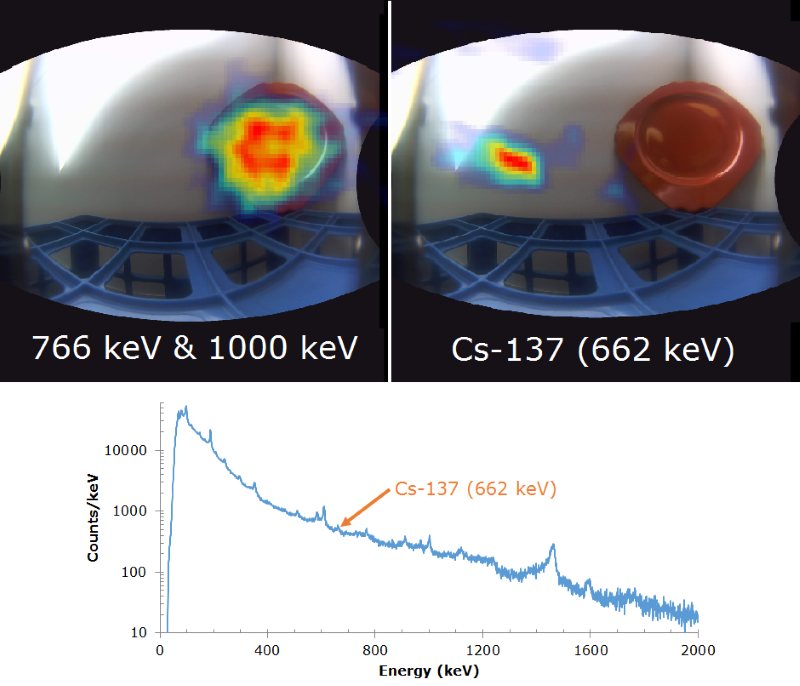
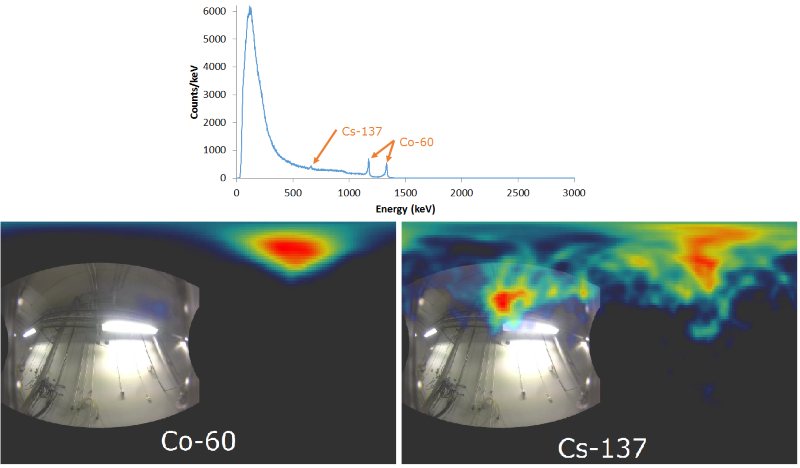
The 3-minute measurement below was in a region with a strong shielded Co-60 source behind and above an H100. Imaging events in the Co-60 peaks, Co-60 is easily located. Imaging events in the Cs-137 energy window, we see down scatter from the material around Co-60, but also a hot spot in front of and above the H100 where Cs-137 is truly located. This shows it is possible to find sources even in the presence of significant continuum from a higher-energy source.
15. Differentiating scatter and contamination
When finding a hot spot, it can sometimes be unclear whether it is scattered from a hotter source someplace else or whether it is due to real contamination. Should you shield a source elsewhere, or should you clean this spot?
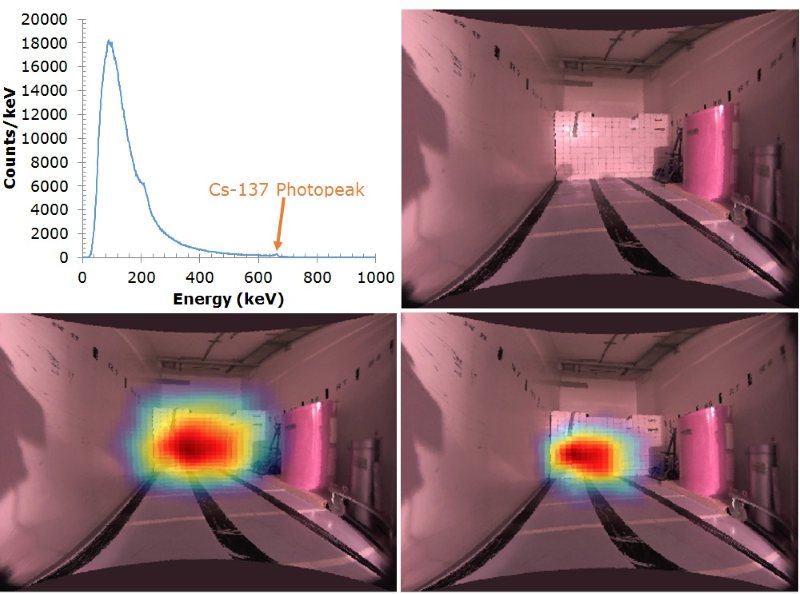
H3D imaging spectrometers are able to differentiate scattered gamma rays from direct gamma rays. In one situation, this allowed a user to determine that unknown contamination thought to be on the walls was actually due to scatter from a source below the room. The image below shows another example. Reactor-head insulation blankets contaminated with Cs-137 are behind this thick shielding wall. The image at the left shows the dose image that images all energies, including gamma rays scattered in the wall. The image at the right shows the Cs-137 image that only includes full-energy gamma rays directly from the source, highlighting the location of the blankets. In any cleanup, we now know that contamination only covers the smaller area, though high dose is observed coming from a wider area of the wall.
16. Contamination control
It is important that contamination does not spread outside of known contaminated areas. S-series or H-series detectors can be placed outside of hatches or doorways to contaminated areas and used to monitor contamination. If contamination is being tracked outside of the area, appropriate actions can be taken immediately. This can also help reduce the number of workers required to perform contamination control.
Any we missed?
Please let us know how you are using H3D detectors at your facility.
H3D, Inc.
Ann Arbor, MI, USA
©Copyright 2014-2025


Contact Us
Privacy Policy | Conflict of Interest Policy