
X
Radiation safety is often a prominent concern for nuclear power plants, nuclear waste-processing sites, and emergency-response situations. Not many people worry about radiation in their everyday lives, especially at home. The radiation dose rate that the average person encounters at home is quite low, but it may still be of concern. An H3D employee performed experiments with an H3D detector to show that the technology is capable of visualizing one of these unregulated, common sources of radiation.
Introduction
Naturally Occurring Radioactive Material (NORM) is a common source of radiation exposure in mining and natural-gas operations, but it can also be a significant source of exposure in the home. Radon is an odorless gas and source of NORM that moves through cracks in a house's foundation. Many homes have radon-mitigation systems, which are used to reduce exposure to this harmful gas. Radon can accumulate inside a building and, with chronic exposure, affect the health of those inside.
An H3D employee who owns a Geiger counter noticed an elevated reading when he took a measurement in his basement. The elevated readings appeared to implicate the dehumidifier and furnace filter as radiation sources. To ensure he learned all he could about these unexpected readings, this employee set up an experiment in his basement using the H420 and H3D’s Visualizer post-processing software.
Test Information and Setup
The first trial focused on the basement's dehumidifier, which had been running non-stop for over seven years. The dehumidifier filter is cleaned weekly and did not cause any changes to the Geiger counter readings when removed. The H420 was left to measure for 10.5 hours overnight while facing the dehumidifier.
After performing the measurement of the dehumidifier, the H420 was then used to inspect the house's furnace filter. The filter was installed one month prior to this trial and appeared superficially clean. The filter was removed from the furnace and placed vertically against a wall. The H420 was used to perform a 24-hour measurement immediately after its removal from the furnace.
Test Results
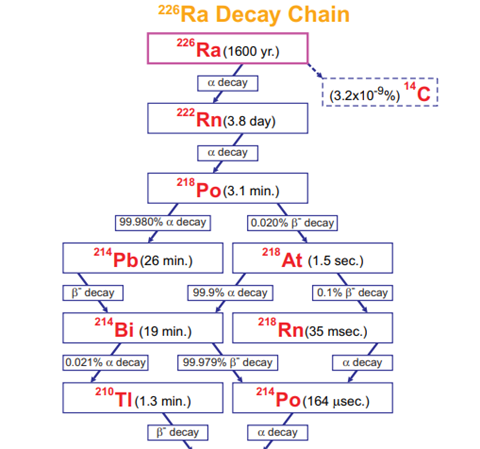
The radiation image and energy spectrum from the 10.5-hour measurement of the dehumidifier are shown below. The radiation image is clearly focused on one specific part of the device and the energy spectrum has clear peaks identifying the radon daughter products Bi-214 and Pb-214 from the Ra-226 decay chain. This measurement implied that the radon products were gathering on the surface of the dehumidifier's internal evaporator coil.
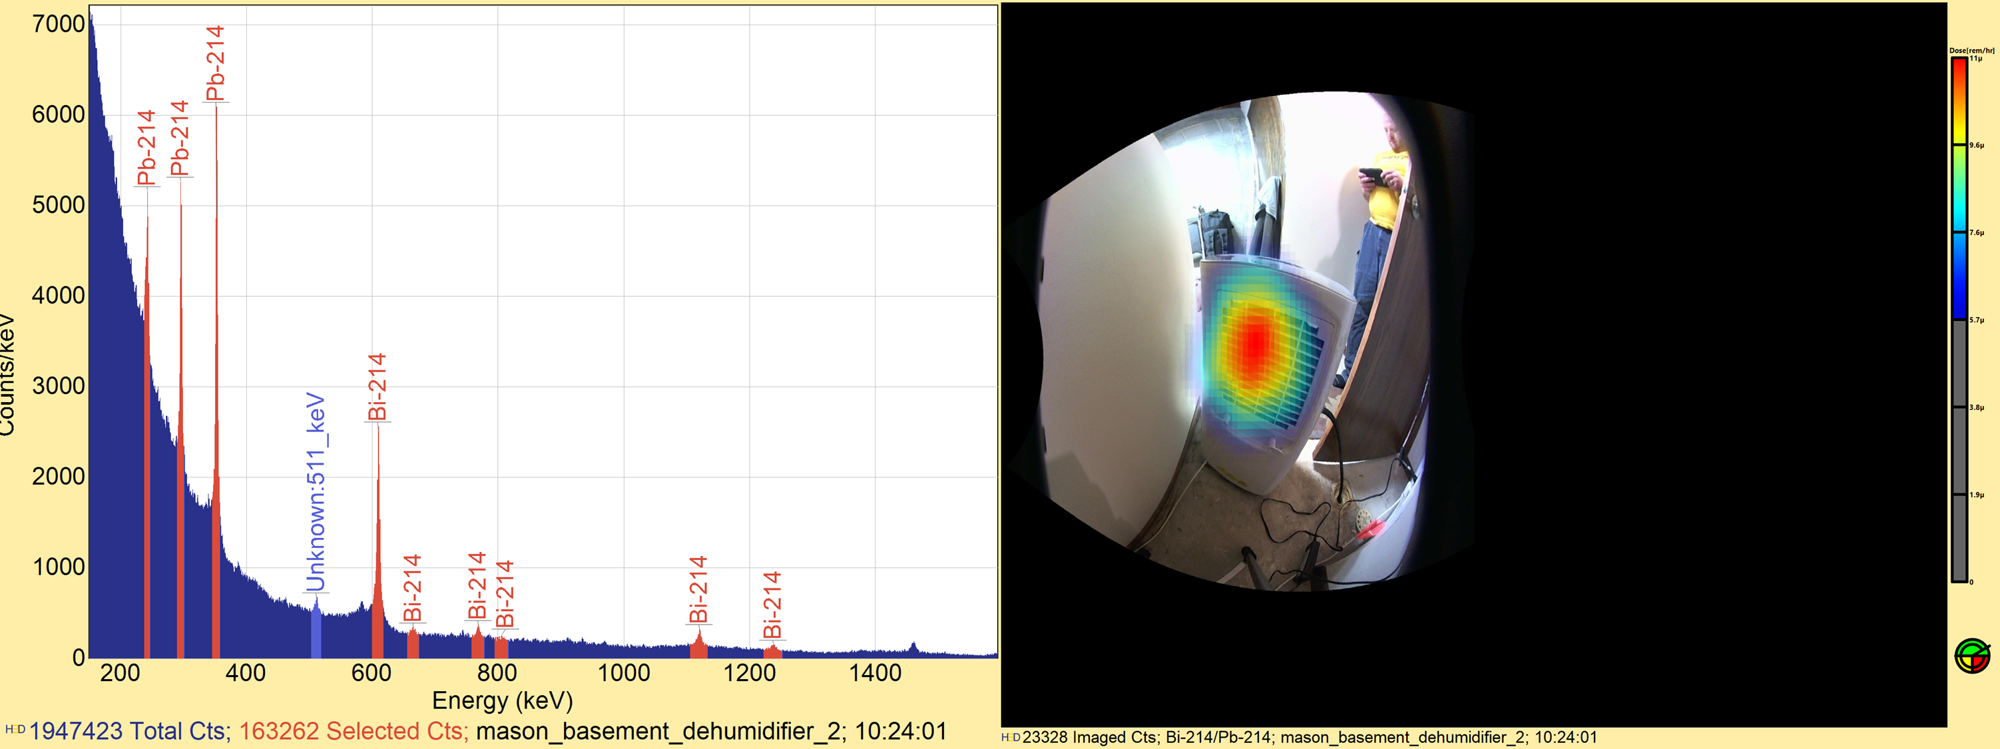 (Left) Radon daughter spectrum. (Right) Associated Compton image.
For the second trial of the furnace-filter measurement, it was noted that the recorded dose rate at the detector began at 17 µrem/hr and dropped to 7-8 µrem/hr after about 2 hours. This is likely because there was no active airflow through the filter during the 24-hour measurement, whereas the dehumidifier operated continuously during the first trial. The H420 identified Bi-214 and Pb-214 from the filter, which is part of the decay chain for radon. The radiation image and its associated spectra are pictured below.
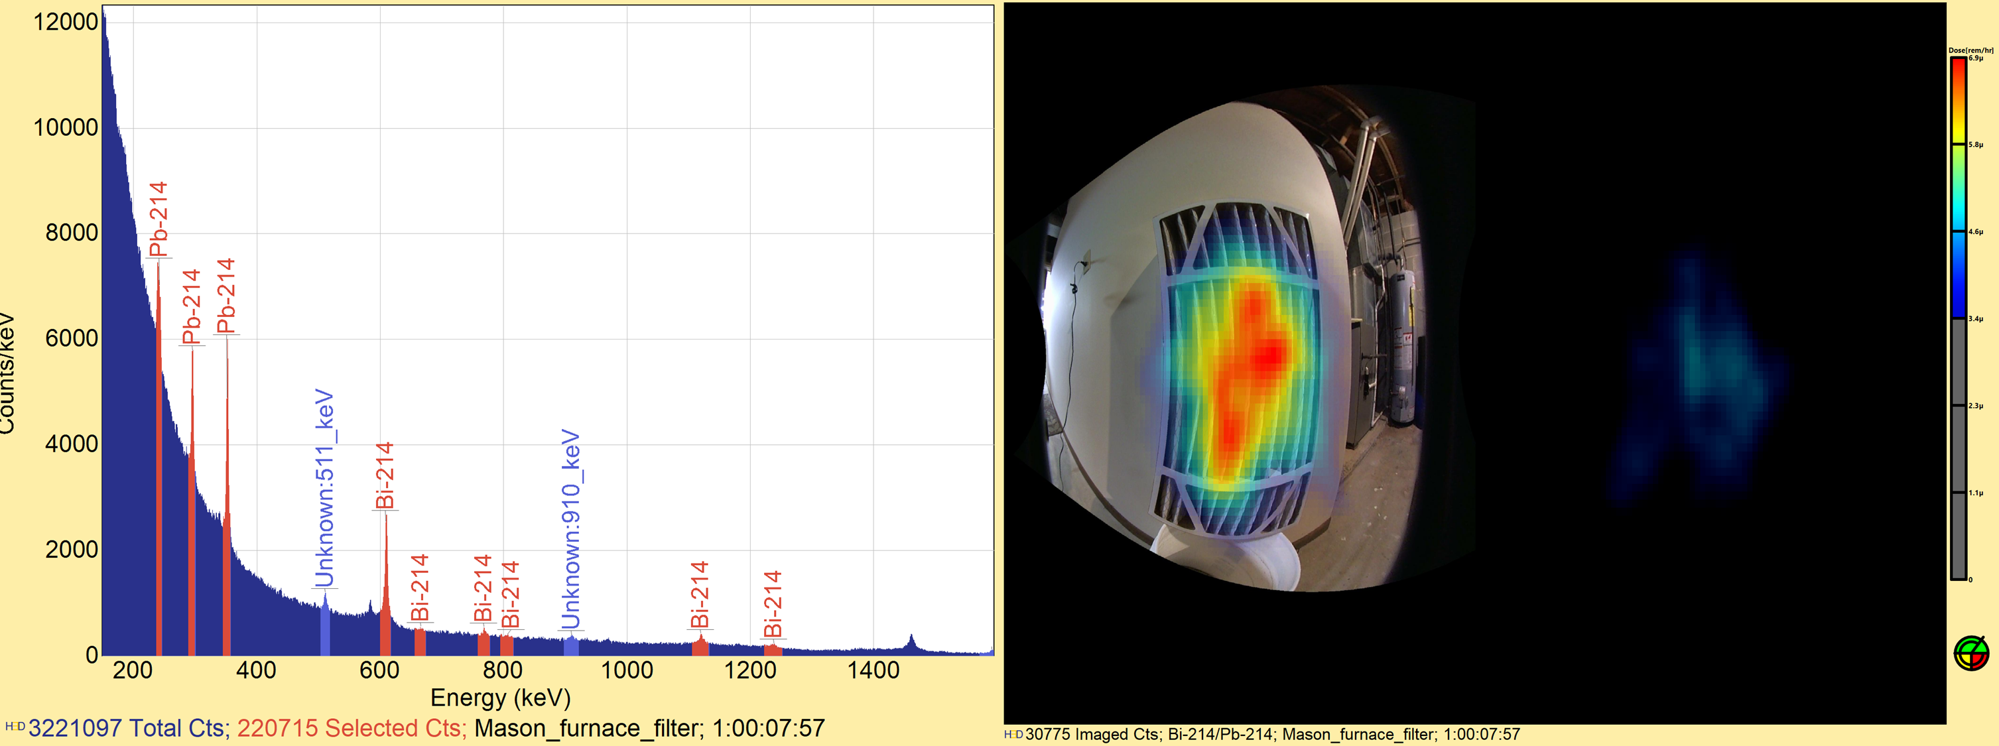 (Left) Radon daughter spectrum. (Right) Associated Compton image.
Conclusions
H3D’s H420 is sensitive enough to image low-level NORM sources
in the home.
Knowing this, one can determine that the H420 can be used
to visualize radiation in a variety of other settings where
NORM sources could be of a concern, such as at fracking sites,
mines, and water-treatment facilities.
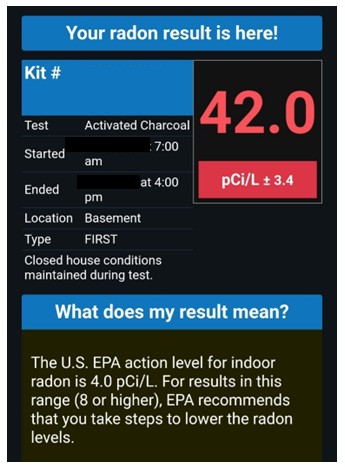
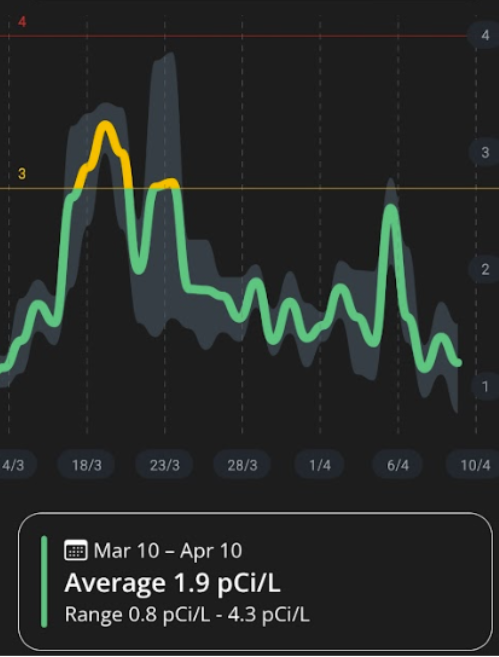
The H3D employee proceeded to buy radon test kits for lab analysis.
The test result showed radon at a concentration of 42 pCi/L,
which is over ten times the U.S. EPA action level. After remediation
average radon levels were below the EPA action level.
Click here directly for more information about CdZnTe-based gamma-ray spectroscopy, imaging, and continious monitoring of gamma-ray emitters.
H3D, Inc.
Ann Arbor, MI, USA
©Copyright 2014-2025


Contact Us
Privacy Policy | Conflict of Interest Policy